5 Best Heatmap Tools To Know In 2024

Understanding how customers interact with your website is essential to know to push sales and retaining them. Heatmaps are essential tools that help you by providing data on users' clicks, scrolls, and movements on your website. This data helps you to know user’s pinpoint and lets you know which page/element of your website attract users more and the areas they ignore completely.
For an e-commerce website, these painpoints show the necessity of optimizing the website to improve conversion rate by providing them with unbeatable solutions. If we talk about SaaS companies, heatmaps reveal where users spend most of their time and which areas they skip completely and help you refine the user interface for better feature adoption.
In both the cases, heatmaps gives you clear, actionable insights that helps you make user-driven optimizination and provide a better user experience, reduce drop-offs, and ultimately increases revenue.
What is a Heatmap?
According to Wikipedia, A heatmap is a visual representation of data that uses color to highlight patterns and trends. In business, heat maps are used to analyze performance, identify areas for improvement, and understand customer behavior. In eCommerce Stores or SaaS product portals, heatmaps typically highlight areas where users click, scroll, or hover their mouse. The warmer colors, like red and orange, indicate higher levels of engagement, and cooler colors, like blue and green, show lower activity.

What Are The Different Types of Heatmaps?
1. Click Heatmaps
Click heatmaps show where users click on a webpage. Click heatmaps help identify which elements are attracting attention, such as buttons, links, and images. They can reveal whether users are engaging with intended call-to-action (CTA) buttons or if they are clicking on non-clickable elements, indicating potential design issues.
2. Scroll Heatmaps
Scroll heatmaps display how far down a page users scroll. The color gradient indicates the proportion of users who reach specific parts of the page, with warmer colors representing higher visibility.
Scroll heatmaps help to understand user engagement with long-form content. They can show if users are missing important content because it is placed too far down the page and losing interest before reaching the end.
3. Move (or Hover) Heatmaps
Move heatmaps track where users move their mouse cursor on the screen. These maps show the areas where users hover their cursor, often indicating where their attention is focused.
Move heatmaps provide insights into which parts of a page draw visual attention. While not always indicative of clicks, these maps can help understand user interest and guide adjustments in content placement and layout.
Many user behavior tools offer heatmap features to improve user experience. We have researched and created the list of…
Top 5 Heatmap Tools For Websites
The following are the top 5 Heatmap tools that will help you boost user engagement, improve user experience, and increase conversion rates.
(1) riyo.ai
14-day free trial
Pricing: $159/user/month
Rating: 4.7/5
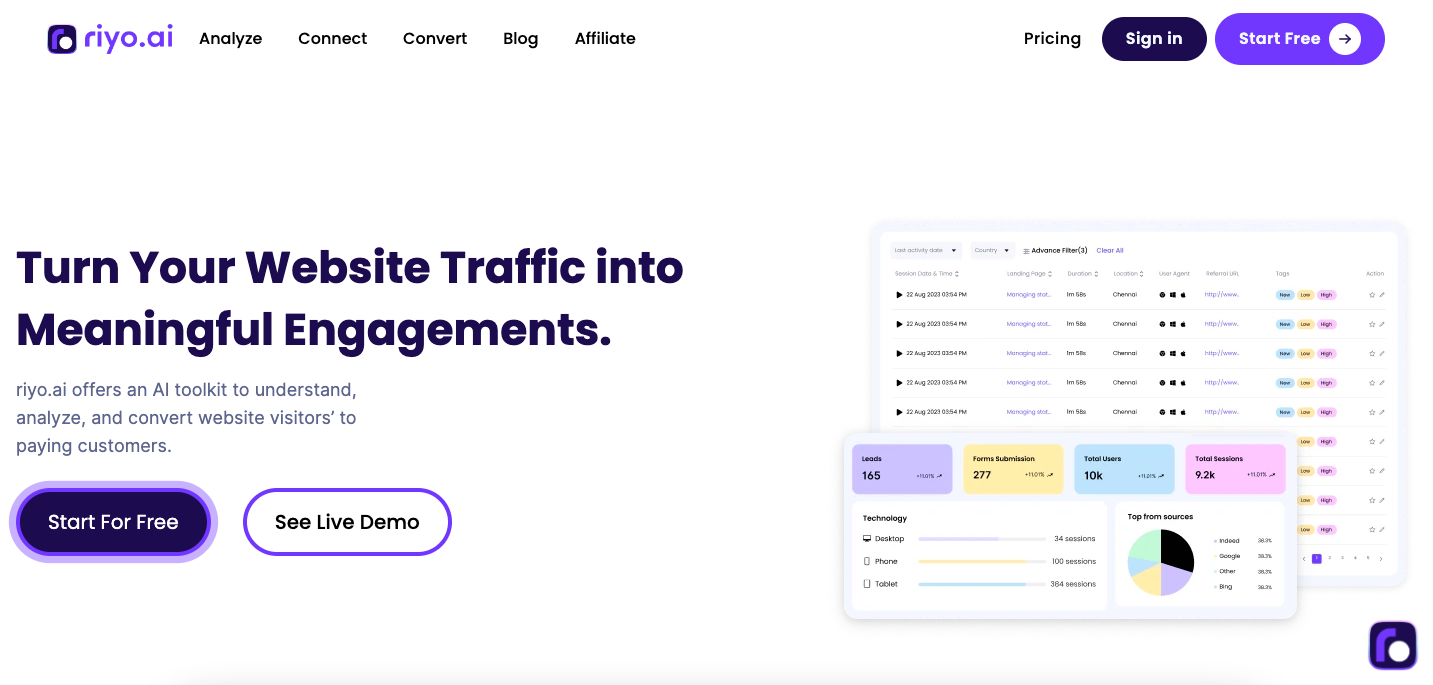
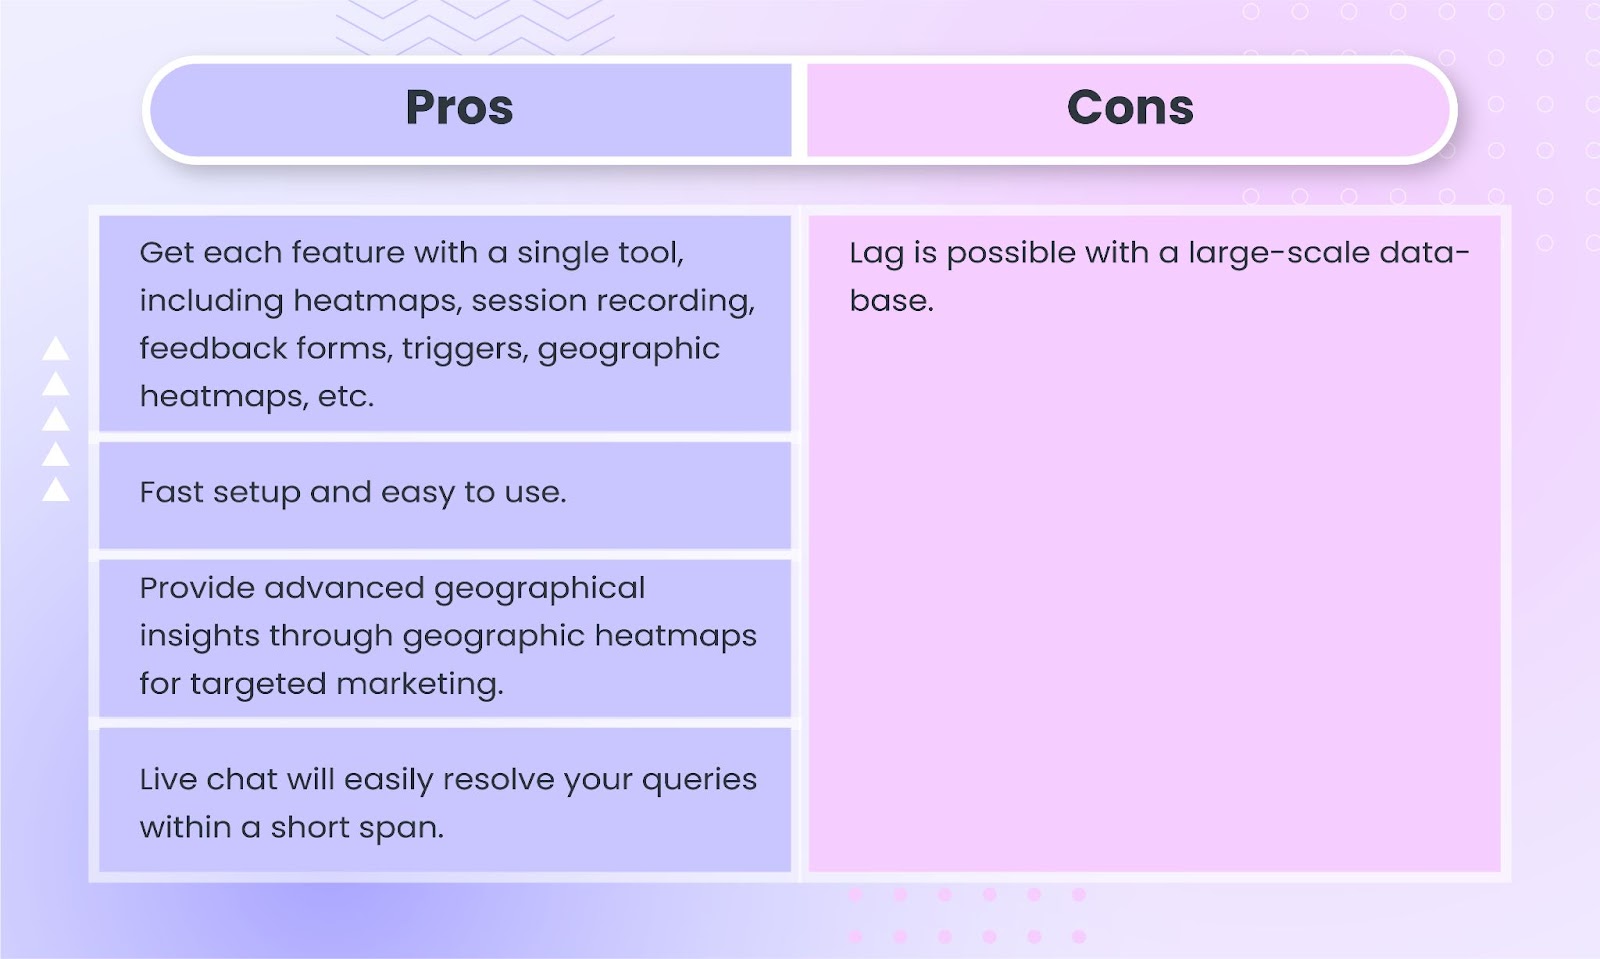
riyo.ai is a competitive and powerful tool designed to analyze user behavior on websites. It provides a vast range of features that enable businesses to gain deep insights into user interactions, helping them optimize their websites and improve user experience effectively.
Features:
- Click Heatmap: This shows where users click the most on the website page and which element they ignore the most.
- Scroll Heatmap: This feature shows how far down a page users scroll, helping identify which parts of the content are most and least viewed.
- Hover Heatmap: It tracks where users hover their mouse, indicating areas of interest and attention.
- Geographic Heatmap: This displays user interactions based on geographic locations, providing insights into regional behavior patterns.
- Session Recording: riyo.ai records visitor sessions, allowing businesses to watch real-time user interactions and gain deeper insights into user behavior and potential pain points. These sessions are shareable, so you can share them with your team members to fix the bugs.
- Live Chat: The live chat feature enables real-time communication with website visitors, improving customer support and engagement.
- Feedback Form: riyo.ai includes tools for collecting direct feedback from users, providing valuable qualitative data to complement quantitative analytics.
- Top Traffic Channels: This feature identifies the most significant sources of website traffic, helping businesses understand which channels drive the most visitors.
- Devices Overview: riyo.ai provides an overview of the devices used by visitors, helping businesses optimize their websites for different screen sizes and devices.
- Browsers Overview: This feature offers insights into the browsers used by visitors, ensuring compatibility and optimal performance across various platforms.
- Operating Systems Overview: riyo.ai provides data on the operating systems used by visitors, helping businesses customize their website experience accordingly.
Ideal For:
riyo.ai is ideal for small to medium-sized e-commerce and SaaS businesses that want an all-in-one solution for user behavior analysis. Its comprehensive feature set makes it suitable for gaining actionable insights and optimizing website performance.
Set up your free heatmap today
Use riyo.ai’s heatmap generator to understand what customers love (and hate) about your site and make empathy-driven improvements.
Start Now
(2) CrazyEgg
30-day free trial
Pricing: $249/user/month
Rating: 4.5/5
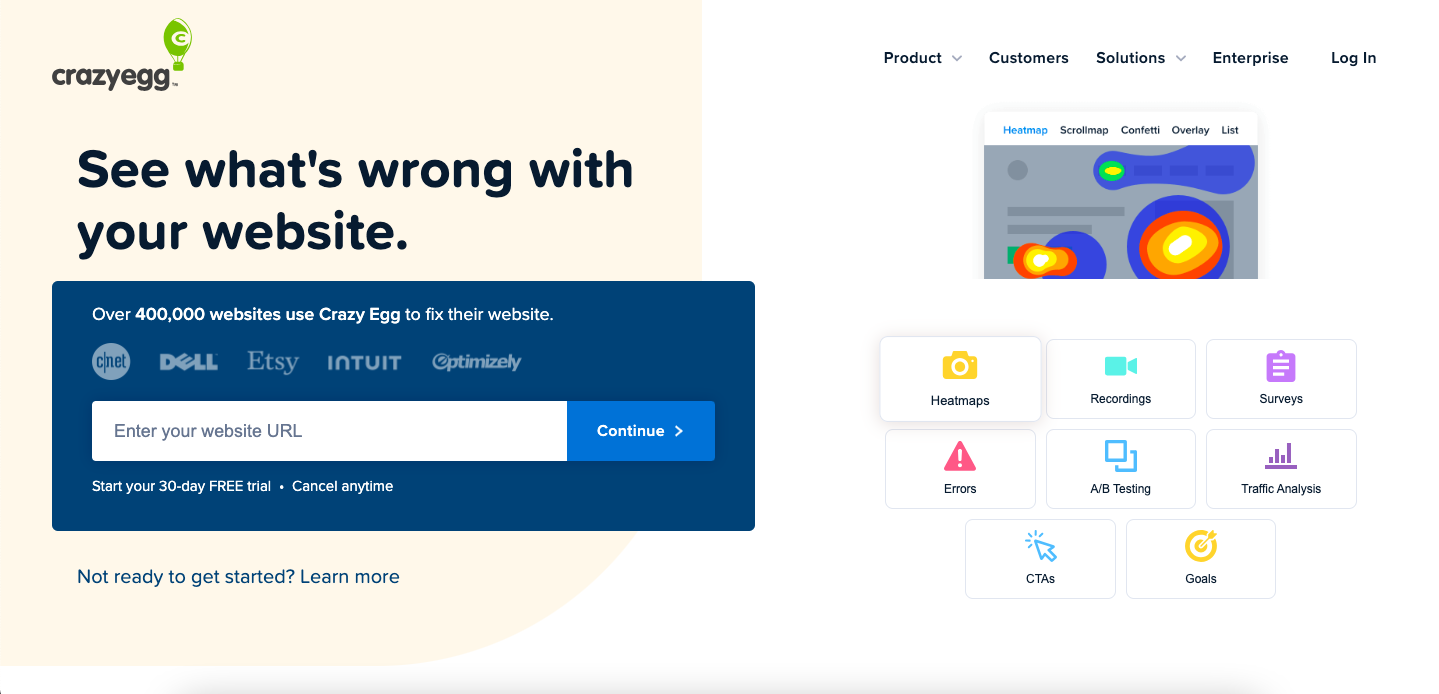
CrazyEgg is another recommended tool for analyzing user behavior on websites. It offers various features that help businesses gain insights into how visitors interact with their site, allowing them to make data-driven decisions to improve user experience and optimize conversions.
Features:
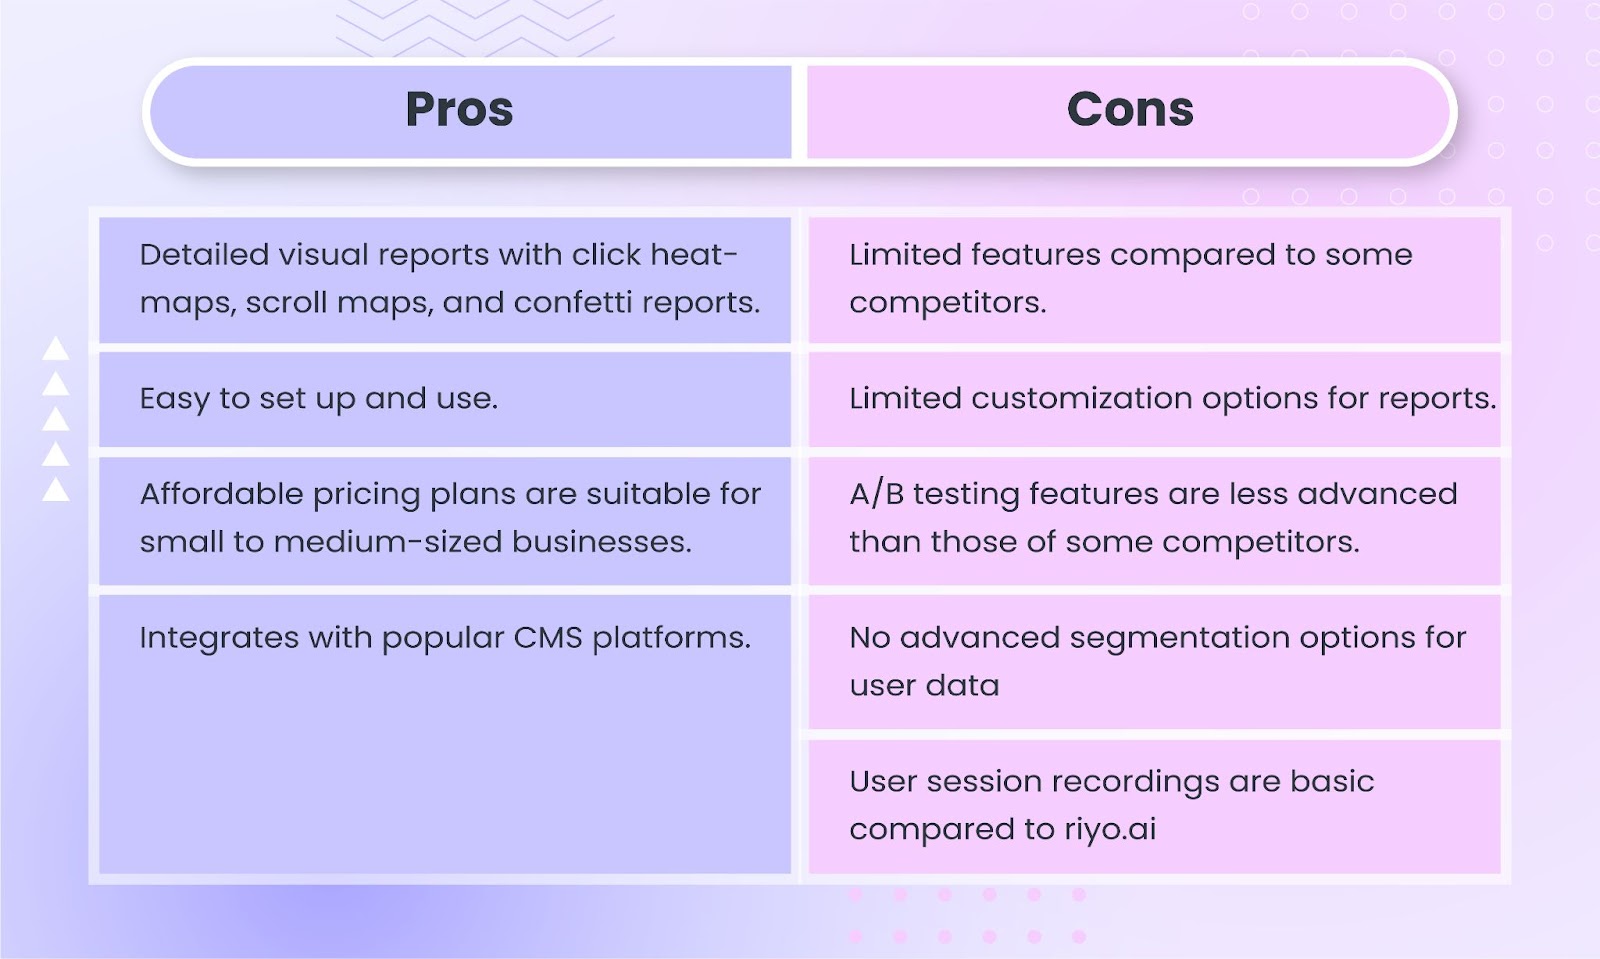
- Heatmaps: Click heatmaps that visualize where users click on a webpage and scroll maps that reveal how far down users scroll.
- Confetti Reports: These reports offer a granular view of individual clicks segmented by referral sources, search terms, and more, providing deeper insights into user behavior.
- A/B Testing: CrazyEgg includes tools for A/B testing, allowing businesses to test different versions of a webpage to determine which performs better.
- User Session Recordings: This feature records visitor sessions, allowing businesses to watch real-time user interactions and gain deeper insights into user behavior and potential pain points.
- Integration with Popular CMS Platforms: CrazyEgg integrates seamlessly with popular content management systems (CMS) like WordPress, Shopify, and more, making it easy to implement and use.
Ideal For:
CrazyEgg is ideal for businesses needing a straightforward, cost-effective heatmap tool. Its easy setup, user-friendly interface, and detailed visual reports make it a valuable asset for gaining insights into user behavior and optimizing website performance.
Click here
(3) Hotjar
15-day free trial + free plan available
Pricing: $171/month
Rating: 4.5/5
Hotjar is popular for analyzing user behavior on websites. It offers a comprehensive suite of features that help businesses understand how visitors interact with their site, helping them to make data-driven decisions to improve user experience and increase conversions.
Features:
- Click Heatmaps: Hotjar's click heatmaps provide a visual representation of where users click on a webpage, highlighting popular and ignored elements.
- Move Heatmaps: These heatmaps track cursor movements, showing where users hover their mouse, which often indicates areas of interest.
- Scroll Heatmaps: Scroll heatmaps reveal how far down a page users scroll, helping identify which parts of the content are seen the most and which are overlooked.
- Session Recordings: Hotjar records visitor sessions, allowing businesses to watch real-time user interactions and gain deeper insights into user behavior and potential pain points.
- Visitor Behavior Insights: These insights help identify user engagement patterns and areas of improvement.
- Feedback Polls and Surveys: Hotjar includes tools for collecting direct feedback from users through polls and surveys, providing valuable qualitative data to complement quantitative analytics.
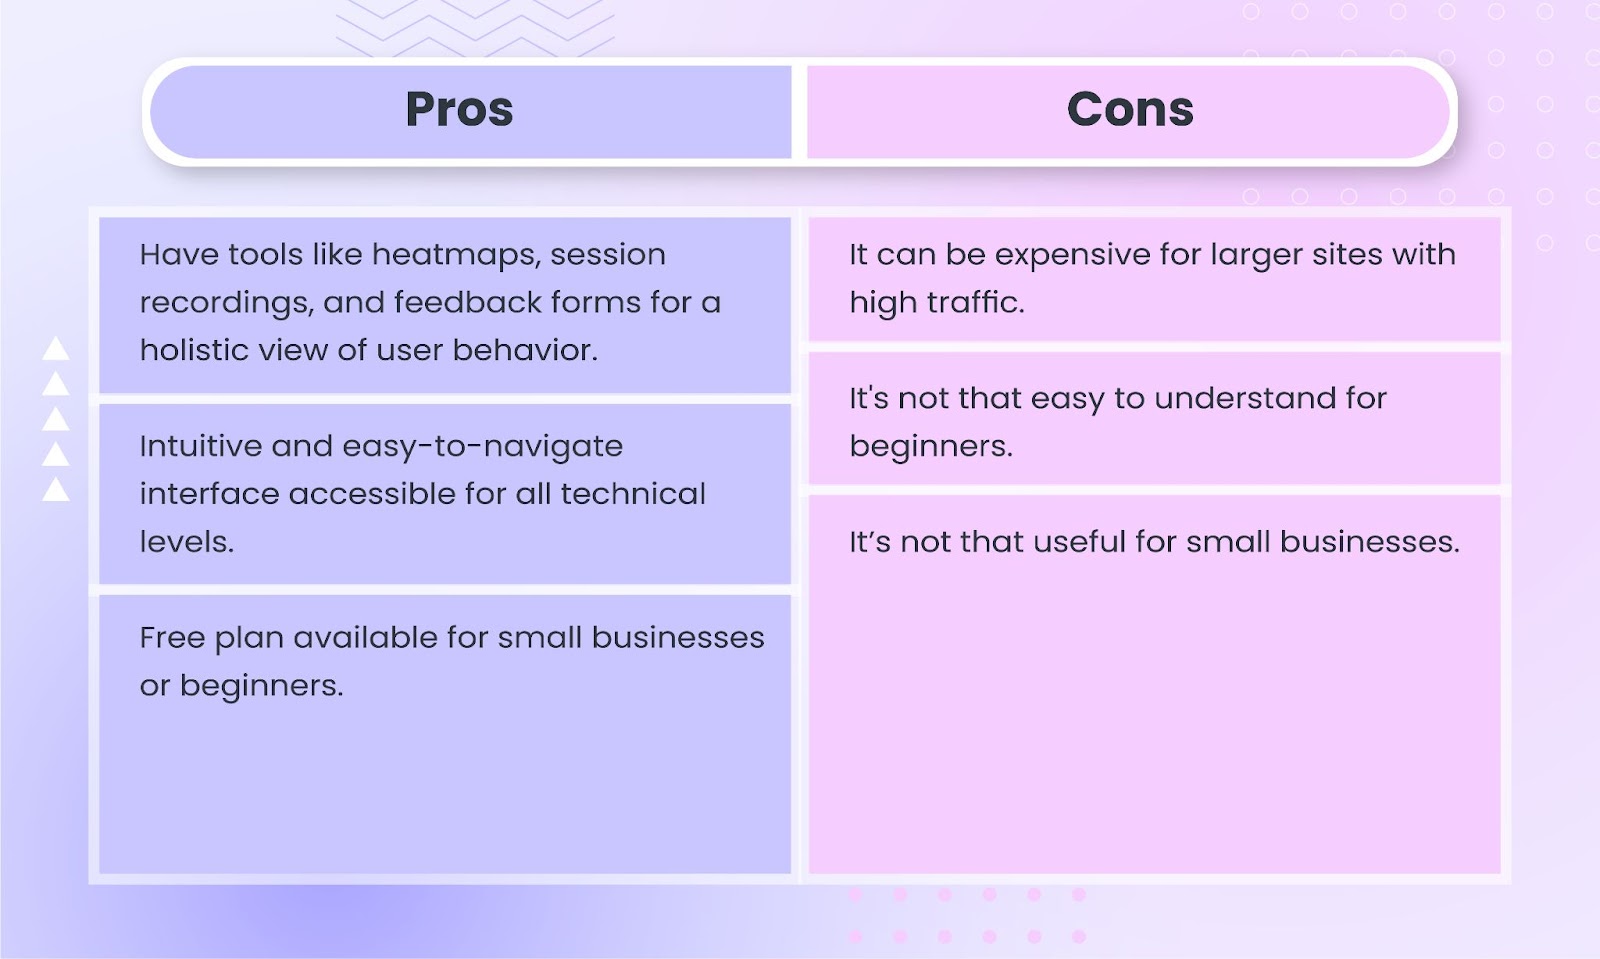
Ideal For:
Hotjar is ideal for all types and sizes of businesses for user behavior analysis. Its feature set and user-friendly interface make it a valuable tool for gaining actionable insights and optimizing website performance.
Read the 5 alternatives to Hotjar and choose the best
Click to know
(4) Lucky Orange
7-day free trial + free plan available
Pricing: $600/month
Rating: 4.6/5
Lucky Orange is designed to improve user engagement and provide valuable insights into website performance. With a comprehensive feature set, it allows businesses to understand user behavior and optimize their websites effectively.
Features:
- Dynamic Heatmaps: Lucky Orange offers dynamic heatmaps that visualize user interactions on a webpage, highlighting areas of high engagement.
- Session Recordings: This feature records visitor sessions, helps businesses to see how users navigate their site and identifies potential pain points.
- Live Chat: This tool allows users for real-time communication with visitors, improving customer support and engagement.
- Conversion Funnels: Provides conversion funnel analytics, helping businesses understand the steps users take before completing a desired action.
- Form Analytics: Tracks form submissions and interactions, providing insights into how users engage with forms on the website.
- Real-Time Analytics and Visitor Profiles: Businesses can access real-time analytics and detailed visitor profiles, allowing for timely adjustments and targeted marketing strategies.
Click to know
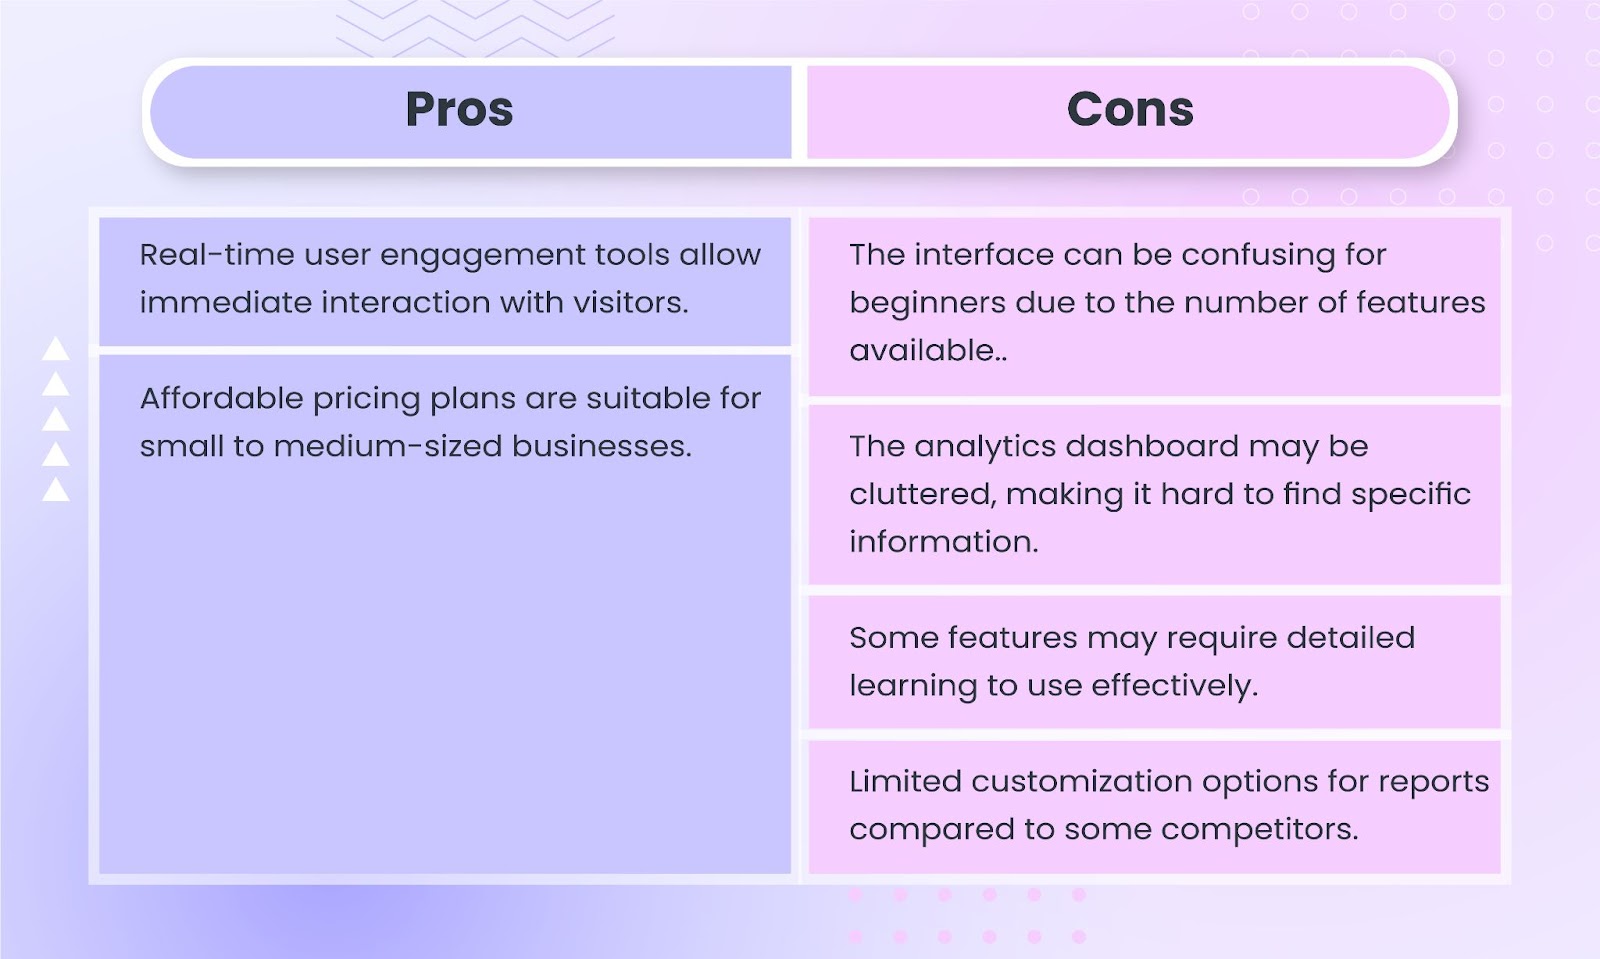
Ideal For:
Lucky Orange is ideal for businesses that need complete user engagement and analytics tools. Its features and real-time capabilities make it a valuable asset for companies looking to improve user experience and optimize website performance.
(5) Mouseflow
14-day free trial + free plan available
Pricing: $399/month
Rating: 4.6/5
Mouseflow is another reputed tool that provides an in-depth analysis of user behavior and optimizes conversion rates. It offers various features that help businesses gain valuable insights into how visitors interact with their websites.
Features:
- Click, Scroll, and Movement Heatmaps: Mouseflow provides heatmaps that track clicks, scrolling behavior, and mouse movements, offering a visual representation of user engagement.
- Session Replay: This feature allows businesses to watch recordings of individual user sessions, providing insights into how users navigate and interact with the site.
- Funnel Analysis: Mouseflow's funnel analysis helps track user progress through conversion paths, identifying drop-off points and areas for improvement.
- Form Analytics: The platform analyzes form interactions to understand user behavior and improve usability.
- Customizable Feedback Surveys: Mouseflow includes tools for creating and using feedback surveys, allowing businesses to gather direct input from users.
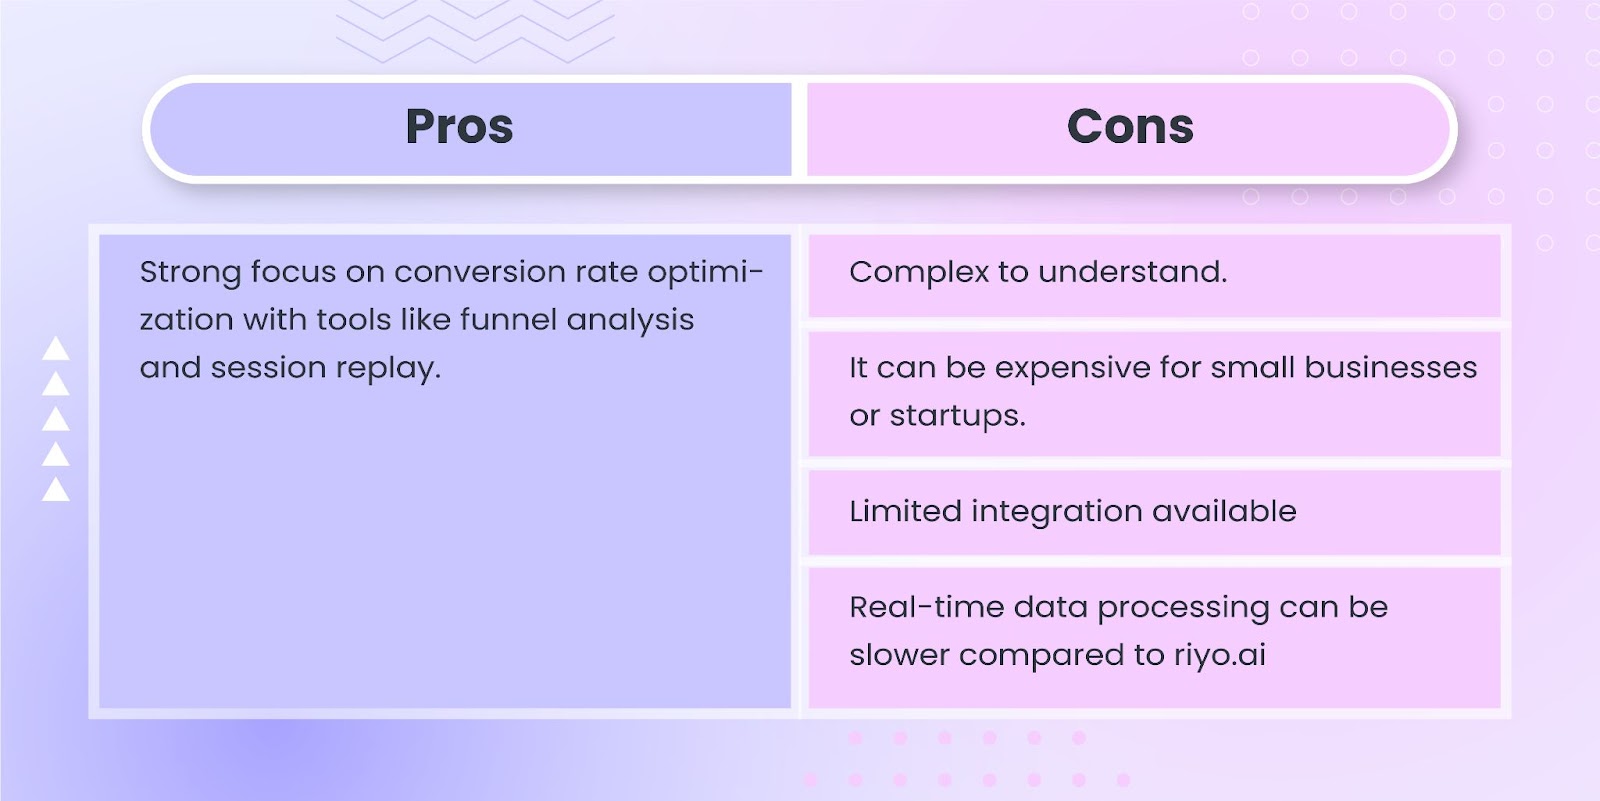
Ideal For:
Mouseflow is ideal for businesses focused on in-depth analysis and conversion optimization. Its comprehensive features and advanced filtering options make it suitable for companies seeking detailed insights into user behavior
Set up a heatmap today🔥
With riyo.ai, you can use heatmaps to find out how users move, click, and scroll through your pages.
Start NowFAQs
(1) Does Google Analytics have a heatmap feature?
Not directly. Google Analytics 4 (the newest version) doesn't have built-in heatmaps. You need to use tools like riyo.ai to capture heatmaps.
(2) What is the best use of a heatmap?
Heatmaps are great for understanding how users visually engage with your website. They reveal click patterns, scrolling behavior, and areas of attention, helping identify usability issues and optimize content placement for better user experience and conversions.
(3) Can I rely entirely on heatmaps?
Heatmaps offer valuable insights and tell the whole story. They show users clicking or scrolling a certain way. Combine heatmap data with other analytics to get a complete picture of user behavior.
(4) Why use heatmap tools in UX design?
UX designers use heatmaps to see how real users interact with website prototypes and designs. This helps identify areas that might be confusing or require improvement, leading to a more user-friendly final product.


Tapan Patel- BDM
As the head of sales & marketing, Tapan has expertise in the execution and planning of business growth strategies aligning with marketing trends. Tapan has over 10+ years of experience in IT marketing for creating growth strategies and managing sales.
Get riyo.ai
riyo.ai is easy to set up, easy to understand. Track visitor behavior, understand their identity, and close deals instantly with riyo.ai.
Get Update
Get timely updates on new features, offers, packages, and specially curated companies generation tips and tricks directly sent to your inbox.