Visualize User Engagement
Effortlessly forIn-DepthAnalysis
Analyze every page to see where users click, scroll, and engage. Use these insights
to optimize your website and improve user experience.
14-day free trial. No credit card is required.
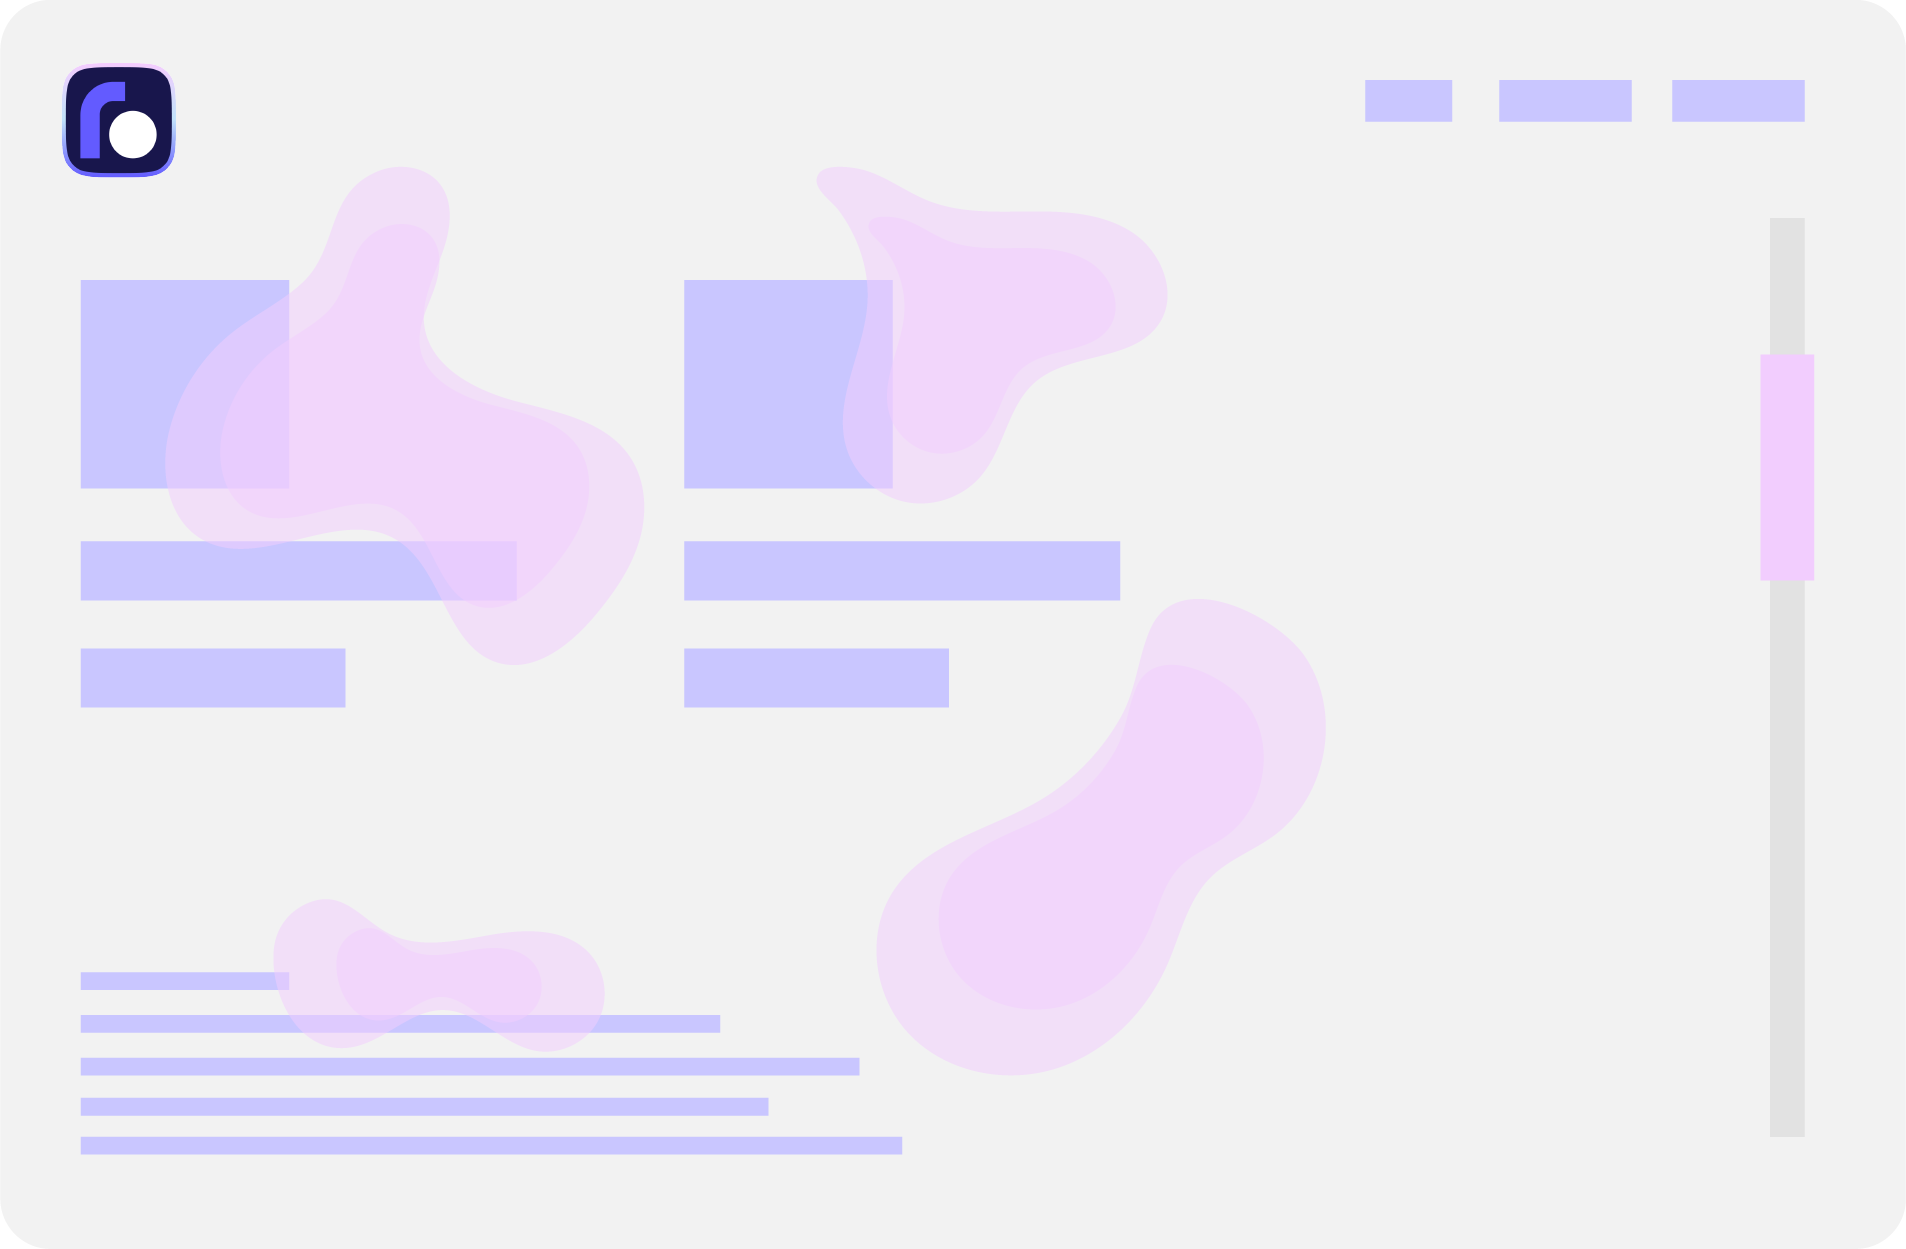
Understand User Interaction with Precision
Visualize user activity through colored maps to see exactly where users are clicking. Use this data to optimize user experience and increase engagement on your website.
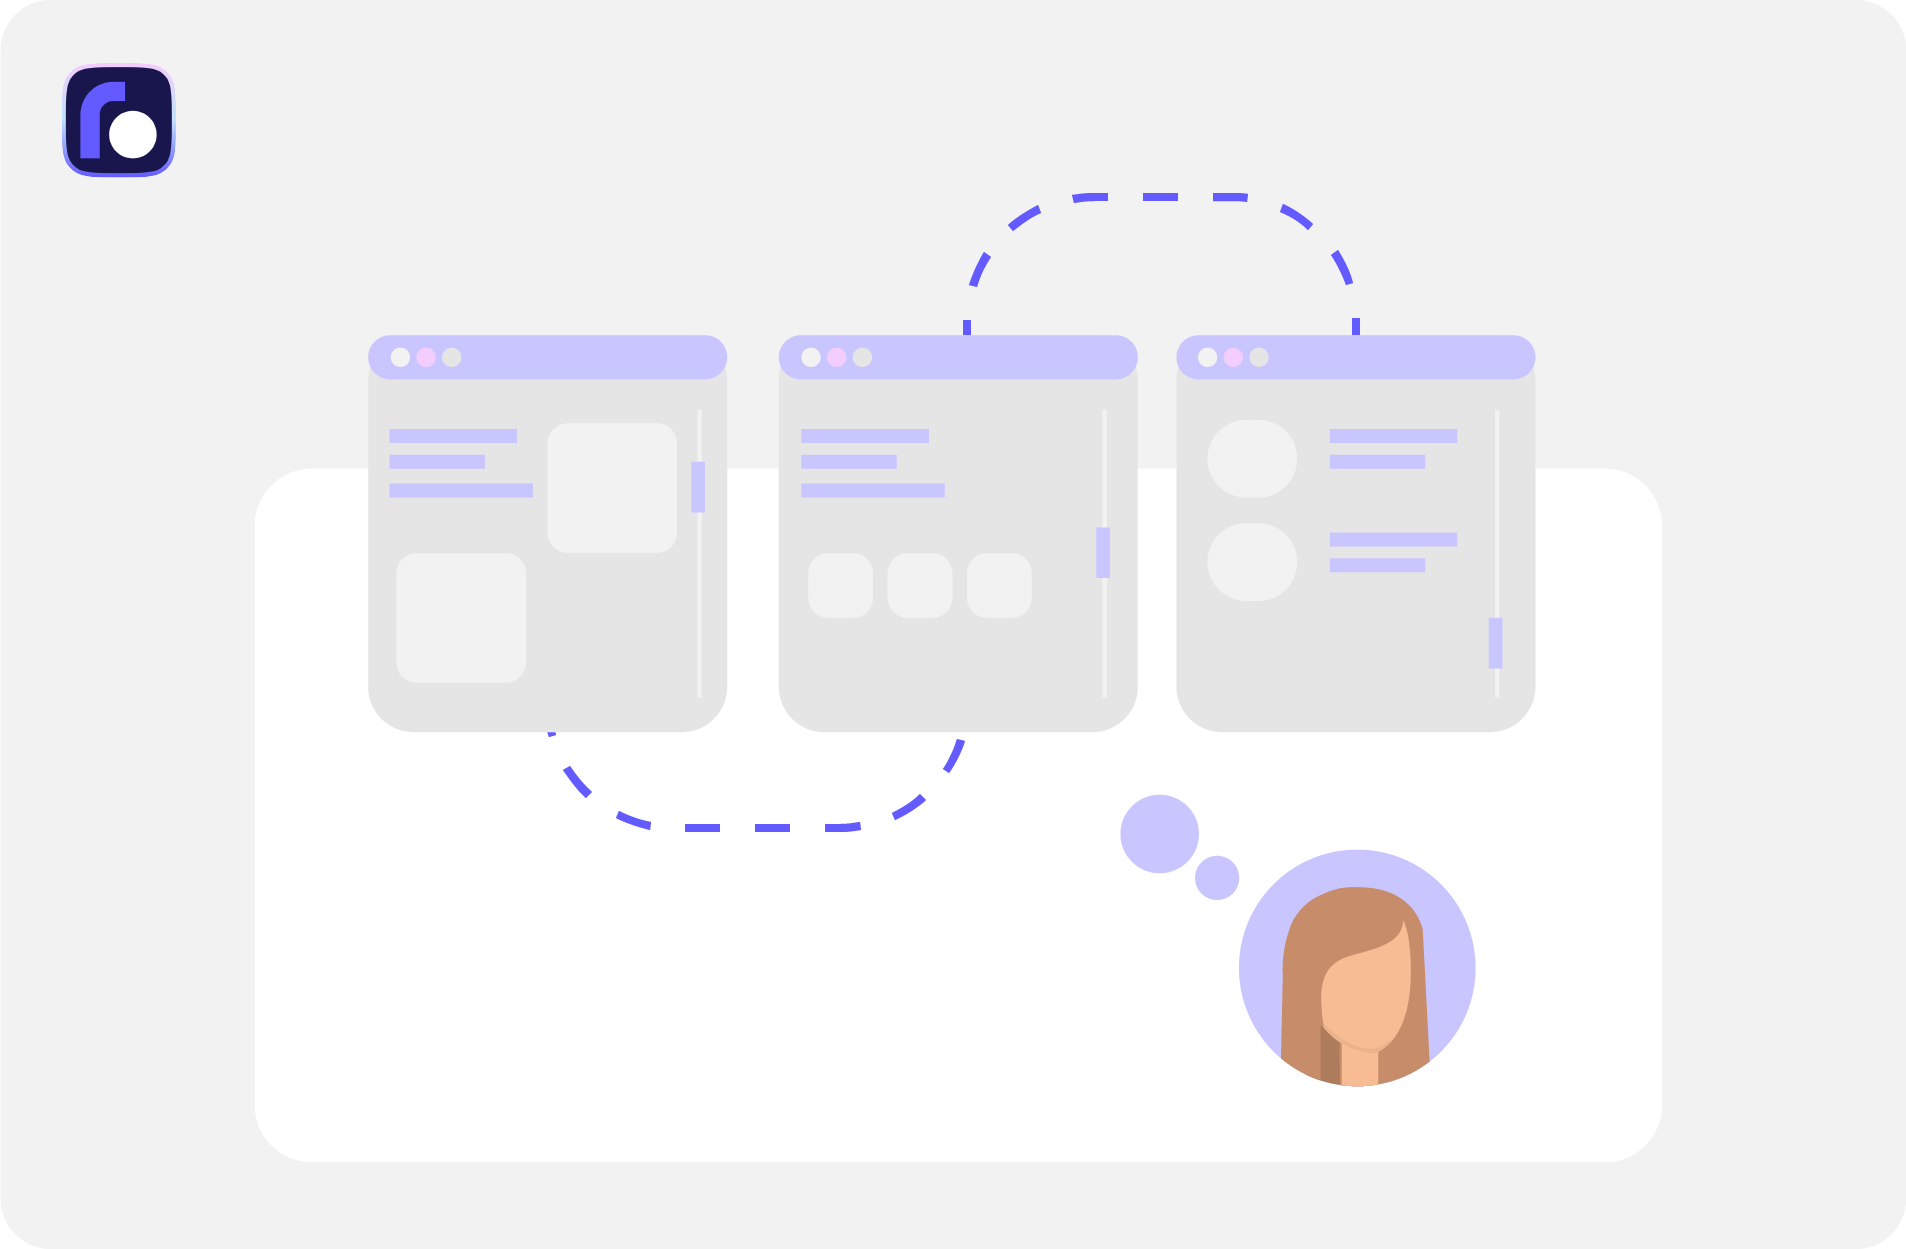
Optimize Content Visibility with Scroll Maps
See how far down the page they scroll and analyze the data to optimize content placement. Use these insights to boost user engagement and make sure key information is seen by your audience.
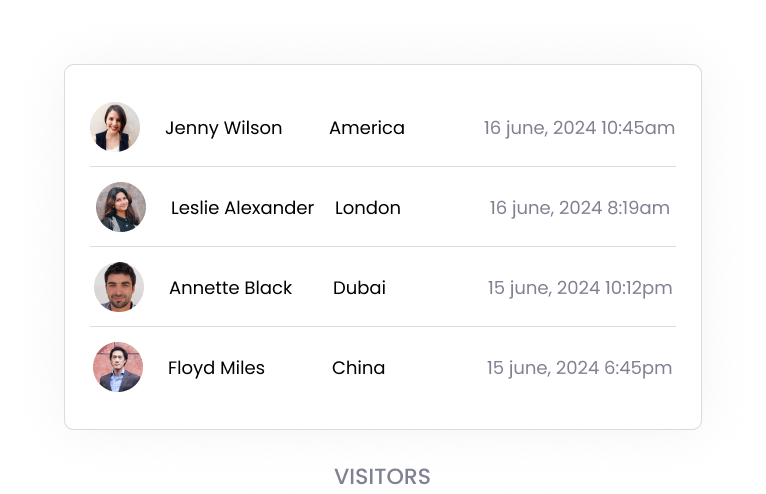
User Experience with Real-Time Insights!
Optimize user journey with Real-time Insights and grow higher engagement. Start improving your strategies today with riyo.ai

Refine Your Data with Precision Filtering
Effortlessly narrow down your data with an advanced filter. Tailor your searches by applying specific criteria to quickly find the information you need.

Experience Your Site Across All Devices
A multi-screen view in heat maps lets you see how users interact with your website on mobile, tablet, and desktop. Analyze user experiences across different devices to ensure seamless performance and optimize your site for all screen sizes.
Ready to see the darkest area of the site?

A heatmap is a visual tool that shows how users interact with your website. It uses colors to represent data, highlighting areas where users click, scroll, or hover the most.
Heatmaps are used to understand user behavior on your website. They help identify which parts of your site attract the most attention and which areas are being ignored.
To create a heatmap, you can use tools like riyo.ai that automatically generate heatmaps by tracking user interactions on your website. Simply install the tool, and it will start collecting data.
Click heatmaps show where users are clicking, scroll heatmaps display how far down a page users scroll, and hover heatmaps indicate where users are hovering their mouse. Each type helps you understand different aspects of user engagement.
Heatmaps help you identify and optimize high-engagement areas, allowing you to improve the user experience and increase conversions by focusing on what works best.
Heatmaps provide insights into user behavior, helping you optimize layout, design, and content placement for better user engagement and site performance.
By identifying key areas of user interaction, heatmaps allow you to enhance those elements, making it easier to guide users toward completing desired actions, thus improving conversion rates.
Anyone with a website, from marketers to web developers, can use heatmaps to gain insights into user behavior and make informed decisions to improve site performance.
Heatmaps can be used in web design, marketing, and UX optimization to understand user preferences, optimize content layout, and improve overall site effectiveness.