5 Ways to improve UX design with Heatmaps

According to Forbes, there are 5.16 billion internet users worldwide. A considerable part of the population interacts with websites and mobile apps daily. There were 1.13 billion websites in February 2023, but 82% were deactivated, and only 200 million were active. However, the number of users and websites is growing daily.
What Is Heatmap?
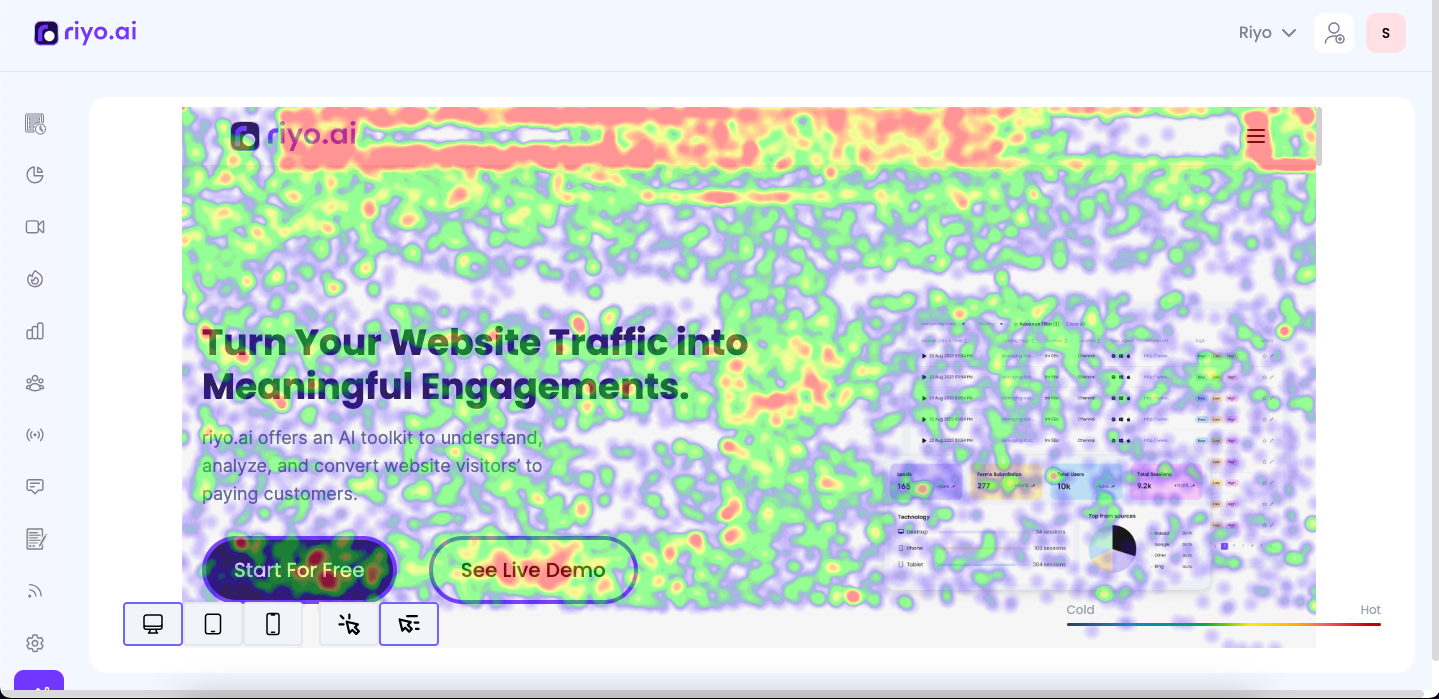
A Heatmap is a graphical representation of user behavior data highlighted in various colors. It is important to analyze what does or doesn’t work on a website or page where the user stays the most. It skips the most, and users engage with the elements of a particular page the most and ignore the most.
Also Read: What is Heatmap? A Comprehensive Guide
Heatmaps make it easy to visualize complex data and help to understand user behavior analytics:
You can collect the data from heatmaps through the following ways,
- Click Maps - Highlights where users click the most and less
- Scroll Maps - Highlights where users scroll the most on a page
- Move Maps - Highlights user's movements on a particular page
What Are The Benefits Of Using Heatmaps For Better UX?
1. Know In-Depth User Behavior Analytics
Heatmaps visually represent how users interact with a webpage, highlighting the most and least engagement areas. By analyzing these patterns, UX designers can understand user preferences, behaviors, and pain points in-depth. For instance, heatmaps can reveal which elements users click on the most, where they linger, and which sections they ignore. This granular insight helps identify and address usability issues, ensuring the website aligns better with user needs and expectations.
2. Get Data-driven Insights
Heatmaps provide concrete data that can drive UX decisions. Instead of relying on assumptions or anecdotal evidence, designers can base their improvements on real user interactions. This data-driven approach improves the credibility of UX changes and helps make informed decisions. Suppose a heatmap shows that users frequently click on an unlinked image, expecting it to be a hyperlink. In that case, designers can update the webpage to improve navigation and user satisfaction.
3. Provides Optimization Opportunities
By knowing user interaction patterns, heatmaps highlight areas that need optimization. This could include repositioning important content, redesigning call-to-action buttons, or adjusting layout elements to improve user engagement and conversion rates. Suppose if heatmaps show that users are not scrolling down to see important information; this might prompt a redesign to make that information more accessible. Consequently, heatmaps help identify issues and test and validate the effectiveness of changes made to enhance the overall user experience.
What Are The Best 5 Ways To Use Heatmaps To Evaluate UX?

1. Showcase Your Best-performing Design
Heatmaps can help identify which design elements are performing exceptionally well. By highlighting areas with the highest engagement, designers can pinpoint the elements that users find most appealing and effective. This insight is important for replicating successful design patterns across other pages or future projects. E.g., if a particular layout or color scheme attracts more clicks and interaction, it can be a model for improving different parts of the website. Showcasing these high-performing designs validates the current approach and guides future design strategies.
2. Find CTAs With The Most And Least Clicks
Call-to-action (CTA) buttons are critical for guiding user behavior and driving conversions. Heatmaps can expose which CTAs are receiving the most and least attention. This information allows designers to optimize these buttons' placement, size, and design to maximize their effectiveness. E.g., if a heatmap shows that a CTA in the middle of the page receives fewer clicks than one at the top, it might indicate that users are not scrolling down as much, prompting a page layout redesign. Adjusting CTAs based on heatmap data ensures they are positioned to achieve the highest possible engagement.
Also Read: 8 Best CTA Practices for Higher Conversion Rates in 2024
3. Know How Far Users Are Scrolling
Scroll maps, a type of heatmap, indicate how far users scroll down a page. This data is essential for understanding whether important content is being seen by visitors. If users are not scrolling far enough to reach critical information or key CTAs, repositioning this content higher on the page may be necessary. Additionally, scroll maps can identify where users lose interest, allowing designers to make the content more engaging or concise in those areas. Ensuring that essential elements are within easy reach improves the overall user experience and increases the likelihood of achieving desired actions.
4. Spot Clicks With Problems
Heatmaps can identify unexpected click patterns, such as users clicking on non-clickable elements or links that are not working. These issues can frustrate users and disrupt their experience. By spotting these problematic clicks, designers can correct misleading elements, add necessary links, or improve the clarity of the interface. E.g., if a heatmap shows numerous clicks on an image that isn’t linked, users expect it to lead somewhere. Addressing these issues helps streamline the user journey and reduces friction points that could lead to abandonment.
5. Optimize The Website For All Devices
Heatmaps can be generated for desktop and mobile website versions, providing insights into how users interact with different devices. Given the significant variation in user behavior across devices, this is important for ensuring a seamless user experience.
Heatmaps help identify device-specific issues, such as ad buttons that are too small on mobile scenes or content that does not display correctly. By optimizing the design for each device based on heatmap data, designers can ensure that the website performs well and offers an intuitive experience regardless of how it is accessed.
Using Heatmaps With Other UX Tools
1. Heatmaps + User Behavior Analytics Tools
User behavior analytics tools like Google Analytics, riyo.ai, Hotjar, etc., will give you many quantitive and qualitative insights into page views, traffic sources, and users' likes and dislikes, but they can not explain why. Combining heatmaps with these user behavior tools can remove some guesswork; that is why these tools offer heatmaps too to analyze user behavior.
Setup a Heatmap today
Do you have a page with lots of traffic that doesn’t convert? Then, set up a heatmap and start seeing what makes people leave. Try now
With riyo.ai Trends, you can take your heatmap analysis to the next level. Set up a heatmap to analyze user behavior before and after a page launch or redesign, then jump directly from the heatmap to charts to see how engagement evolves.
2. Heatmaps + Session Recording
Session recording tools, such as FullStory, riyo.ai, Hotjar, and Mouseflow, capture and replay individual user sessions, providing a detailed look at how users navigate and interact with your website. When combined with heatmaps, session recordings offer a powerful way to gain deeper insights into user behavior.
Also Read: Best Session Recording Tools To Understand User Behavior On Your Site
Detailed User Interaction Analysis
While heatmaps give you an aggregated view of where users click, scroll, and hover, session recordings allow you to dive into specific user sessions to see the exact path taken. This combination helps us understand the context behind the heatmap data. Suppose a heatmap shows high engagement in a particular section; session recordings can reveal whether users find the content helpful or are confused and clicking around to find more information.
Identifying and Resolving Usability Issues
Heatmaps can highlight problematic areas, such as elements that attract many clicks but lead to high bounce rates. Reviewing session recordings of these interactions allows you to observe the user experience firsthand and identify what might be causing frustration or confusion. This detailed observation helps pinpoint usability issues that need to be addressed, such as non-intuitive navigation, broken links, or misleading design elements.
Improving Conversion rate Optimization (CRO)
Combining heatmaps with session recordings provides a robust foundation for Conversion Rate Optimization (CRO). Heatmaps identify user interaction patterns, while session recordings provide the gist behind these patterns. Suppose a heatmap shows that a CTA is not receiving clicks; session recordings might reveal that users are scrolling past it too quickly or that it is not visually prominent. This insight allows you to make targeted adjustments to improve the visibility and effectiveness of CTAs, ultimately improving conversion rates.
Watch Real User Sessions
Why are users not converting? Use session recordings alongside heatmaps to watch user sessions and uncover the reasons behind user behavior. Try now
3. Heatmaps + Form Analytics
Heatmaps act like a visual X-ray of your forms. They reveal exactly where users click, scroll, and hesitate while filling them out. This can expose hidden issues like confusing layouts, unclear CTAs, or poorly placed buttons. By visualizing these pain points, you can identify areas that hinder form completion and take steps to address them.
Armed with insights from heatmaps, you can optimize your forms for ease of use. This might involve simplifying the layout, clarifying instructions, or strategically placing call-to-action buttons. Heatmaps guide you toward creating a frictionless form experience that drives higher completion rates. They even extend their usefulness to your form's call to action button. Like other website elements, heatmaps can showcase how users interact with the submit button. Low click rates indicate unclear wording or poor placement. Heatmaps help optimize your form's CTA for maximum user engagement and higher conversions.
In short, heatmaps and form analytics work hand-in-hand. Heatmaps bridge the gap between understanding what users do and why they do it by providing a visual layer of user behavior. This synergy helps you to create user-friendly forms that convert.
How To Get Started With Heatmaps For Better UX Experience
The website heatmap tool provided by riyo.ai is easy to use. Add a tracking script, and you'll collect data on every click and scroll within minutes. These colorful visualizations offer invaluable insights, whether your goal is showcasing your work or increasing conversions by improving the UX experience of your website.
Also Read: Best AI Tools For UX Designers To Know In 2024
FAQs
What is the purpose of using heatmaps on the website?
Heatmaps visualize user behavior, revealing how visitors interact with your content and design. This helps you understand what works and needs improvement, improving user experience and conversions.
How do I add a heatmap to my website?
It's simple! Choose a heatmap tool (riyo.ai, Hotjar, Crazy Egg, etc.), sign up, and get the tracking code. Install the code on your website's backend (or use website builder integrations).
Does Google Analytics provide detailed heatmaps?
No, Google Analytics focuses on traffic and demographics. Heatmap tools offer a more detailed view of user interactions on specific pages.
What is a heatmap data visualization?
Heatmaps use color gradients. Warm colors show areas of high user activity (clicks, scrolls), while cooler colors represent less interaction. This allows you to identify user behavior patterns easily.
When to use heatmaps?
Use heatmaps to improve user experience, optimize design, boost conversions, and better understand user behavior on specific website pages.


Tapan Patel- BDM
As the head of sales & marketing, Tapan has expertise in the execution and planning of business growth strategies aligning with marketing trends. Tapan has over 10+ years of experience in IT marketing for creating growth strategies and managing sales.
Get riyo.ai
riyo.ai is easy to set up, easy to understand. Track visitor behavior, understand their identity, and close deals instantly with riyo.ai.
Get Update
Get timely updates on new features, offers, packages, and specially curated companies generation tips and tricks directly sent to your inbox.